Historical Inflation Parallels – Apples to Pineapples!
What Happens Next?
Financial market observers study historical events and look for parallels that may portend similar outcomes to present day scenarios. Inflation is the current past-to-present market obsession that investors have not had to address for decades. This time, however, comparing inflation past-to-present may not be the most useful historical parallel to determine what comes next.
Where We Are Now
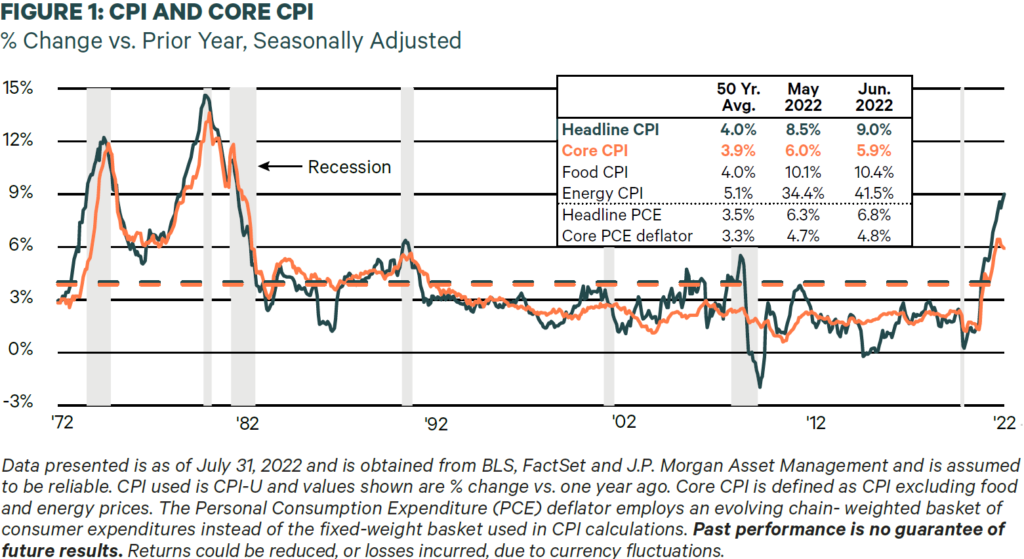
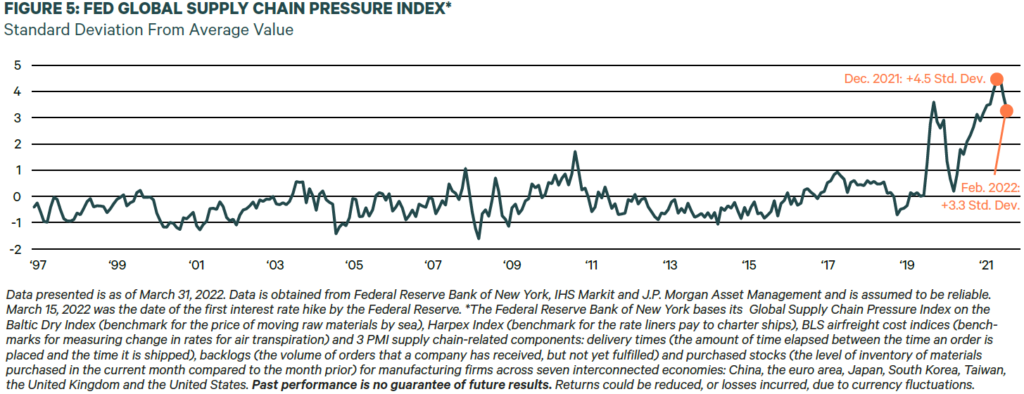
Today’s inflation emerged from the pandemic, which caused lockdowns, supply chain challenges, and large government stimulus flooding the economy. Once lockdowns subsided, people were ready to enjoy life again. Travel, shopping, visiting friends and family, and spending money accelerated quickly. The economy classically had too much money chasing too few goods, causing inflation to rise quickly. Just when things started looking better for the economy and the markets and there was hope that inflation could be contained, the war in Eastern Europe started and sanctions against the Russian Federation triggered shortages in oil, wheat, corn, and other raw materials. To make matters worse, China, to address its “zero COVID policy,” locked down sizable portions of its population post-COVID. A massive drought in the western United States contributed to rising costs of food and energy.
These unforeseen events— impossible to forecast—once again whipsawed supply chains creating more shortages, which spiked inflation further. This soured investor sentiment. As a result, financial markets recorded one of the worst six month starts in more than 50 years.
How does inflation in 2022 compare to the last time inflation was high?
Where We Were Then
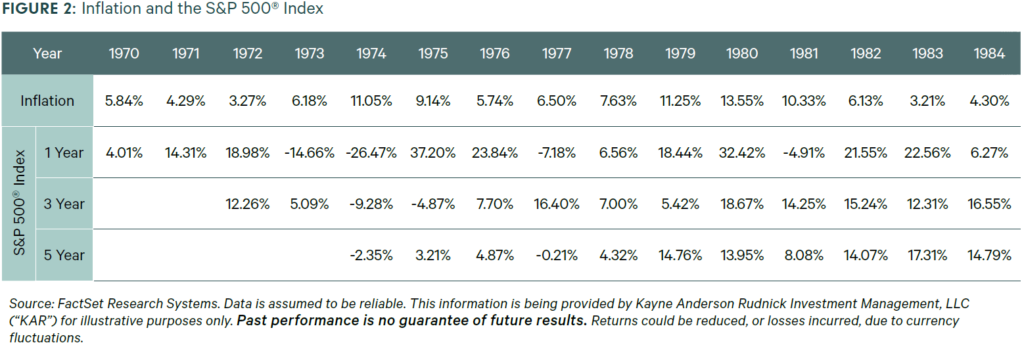
There are more differences than similarities comparing the 1970s-1980s era of high inflation to today’s inflation scenario. The two time periods share the political and economic challenge of inflation, and that is where comparisons end. We like to say any comparisons between the two are like comparing apples to pineapples.
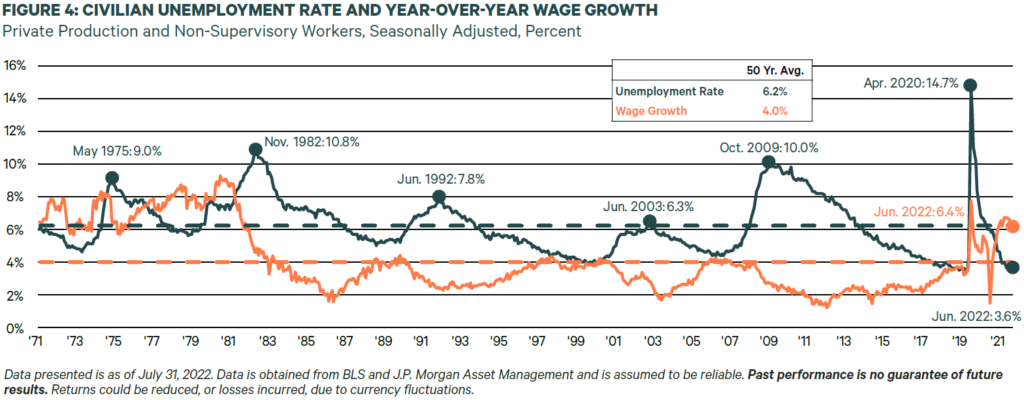
The 1980s experienced double-digit unemployment (10.8% in 1982 vs. 3.6% today)1. The 10-year Treasury in 1981 was at 15.84% vs. 3.00% today2. FreddieMac mortgage rates in 1981 were 16.63%3 compared to about 5.3% today3, and trending lower at the time of this report. Inflation peaked at 14.8% in March 19804, compared to today’s 9.0% for the 12 months ended June 20224. Paul Volker, who served as chair of the Federal Reserve from 1979 to 1987, took drastic steps to end the high levels of inflation throughout the 1970s and early 1980s by raising interest rates to nearly as high as 20%5, which stopped inflation but caused a recession. Today’s federal funds rate is 1.50%-1.75%6 and probably will approach 3.5% by year-end 2022 – low by historic standards. Today’s Fed Chair, Jerome Powell, is taking much slower steps to restrain growth in money and credit, by steadily raising interest rates over time and broadly communicating future rate expectations.
As for the equity markets, in the late 1970s/early 1980s, the stock market was dominated by institutional investors and pension funds, which is no longer true with today’s expansive global capital markets. Inflation had been trending higher since the mid 1960s and had contributed to slow economic growth and bear markets, which had created a sense of malaise among investors.
This culminated in an infamous BusinessWeek cover story in 1979 titled, “The Death of Equities”7, which noted that years of inflation was destroying the stock market due to the distorting effect that inflation had on financial markets and its capital flows. Instead, 1979 was the year that a multi-decade bull market began as investors anticipated the coming peak and ultimate decline in inflation and the removal of its corrosive impacts on the economy and stock markets.
Inflation Rate Forecast for 2022
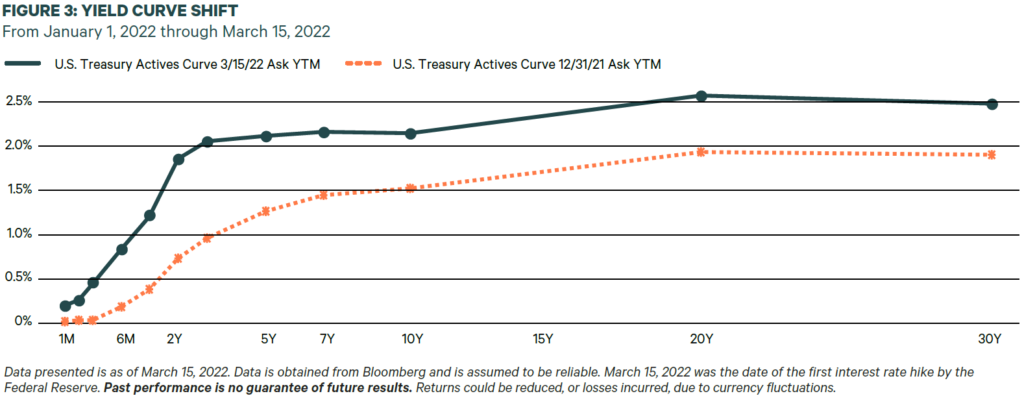
The Federal Reserve started rising rates rapidly to slow the economy (initially by its transparent jawboning beginning in January). This had the effect of getting the bond market to start the heavy lifting of moving interest rates. On top of the 50-basis point moves in March and May, and the 75-basis point increases in June and July, the Fed has forecasted another half-percentage-point rise in September and quarter percentage point moves through November. Classic monetary policy works with a lag of typically 6-to-18 months from the first interest rate increase, which in this case began in January. Figure 3 shows the movement in the bond market prior to the Federal Reserve’s first rate increase in March 2022.
There are signs of inflationary relief on the horizon starting with the consumer (70% of GDP). We have seen material retail sales shortfalls at large retailers and consumer confidence has hit 40-year lows. New orders for the Purchasing Managers’ Index (PMI) have fallen below 50 which signals contraction. Raw materials, such as copper, aluminum, nickel, and zinc, have already experienced significant declines in price in the second quarter. Late in the quarter, even the strongest sectors (oil and semiconductors) started to show significant weakness. The Fed may be closer than investors realize to bringing inflation under control and slowing growth.
While a shallow recession is possible, this should not scare investors. Several strong tailwinds exist to keep recession at bay:
- Unemployment is low—we have widespread employment and millions of job openings.
- Consumers are in good shape financially and have extra cash from government financial support and reduced spending during the pandemic. The same is true of many state and local government municipalities who benefitted from government stimulus along with real estate and sales tax boosts.
- Better supply-side metrics are taking shape with shipping bottlenecks slowly clearing.
These tailwinds should help blunt the worst effects should a recession arrive. We believe the biggest risk is the Fed overshooting rate increases and slowing the economy more than expected. There is also the possibility of more unknown risks, such as the unknowns that surfaced with the war in Ukraine and the China lockdowns that surprised global markets and caused unexpected disruptions and market volatility.
KAR’s Focus
We believe that our continued focus on identifying high quality businesses that benefit from scale, protected markets, and sustainable pricing power means that we identify businesses that are likely to fare better than lower quality companies operating in more competitive markets. This is because we believe that high quality companies are more likely to grow earnings even in an inflation-to-recession economy.
We believe the longer-term market outlook is favorable, as valuations have become attractive with many stocks showing double-digit declines off their highs. The speculation that was rampant across IPOs, SPACs, and meme stocks is nonexistent, which provides a more favorable long-term investing environment. In our view, quality companies have started to perform better on a relative basis, as we would expect given the slowing environment and flattening yield curve. On the fixed income side, we view the current environment as an opportunity to apply fundamental research and active management to source new high-quality tax-exempt bonds at more attractive prices and higher yields to build annual portfolio income.
While we cannot predict a soft-landing, if inflation show signs of slowing, the Fed may not have to be as aggressive raising rates. For long-term investors, one important takeaway from past historical parallels indicates that patience has been rewarded.
1 https://www.thebalance.com/unemployment-rate-by-year-3305506
3 https://www.freddiemac.com/pmms/pmms30
5 https://alfred.stlouisfed.org/graph/?g=SnyV
6 https://alfred.stlouisfed.org/graph/?g=SnyO. As of July 31, 2022.
This information is being provided by Kayne Anderson Rudnick Investment Management, LLC (“KAR”) for illustrative purposes only. Information in this document is not intended by KAR to be interpreted as investment advice, a recommendation or solicitation to purchase securities, or a recommendation of a particular course of action and has not been updated since the date listed on the report, and KAR does not undertake to update the information presented. This article provides links to other websites or resources. KAR has no control over such sites and resources, is not responsible for their availability, and does not endorse and is not responsible or liable for any content, advertising, products, or other materials on or available from them. KAR shall not be responsible or liable, directly or indirectly, for any damage or loss caused or alleged to be caused by or in connection with use of such sites or resources. Your use of such sites or resources shall be subject to the terms and conditions set forth by them.
