“Fast and furious” seems like a reasonable way to describe the onslaught of economic policy actions, plans, postponements, and reversals announced by the Trump administration over the past few weeks. In recent days, the market has been responding in kind—quickly and with a certain fury. Against this backdrop, we firmly believe investors should take the opposite approach by reacting slowly and calmly. That’s a tall order, as sharp declines in stock prices and surges in volatility are unnerving. But panic is a long-term investor’s worst enemy.
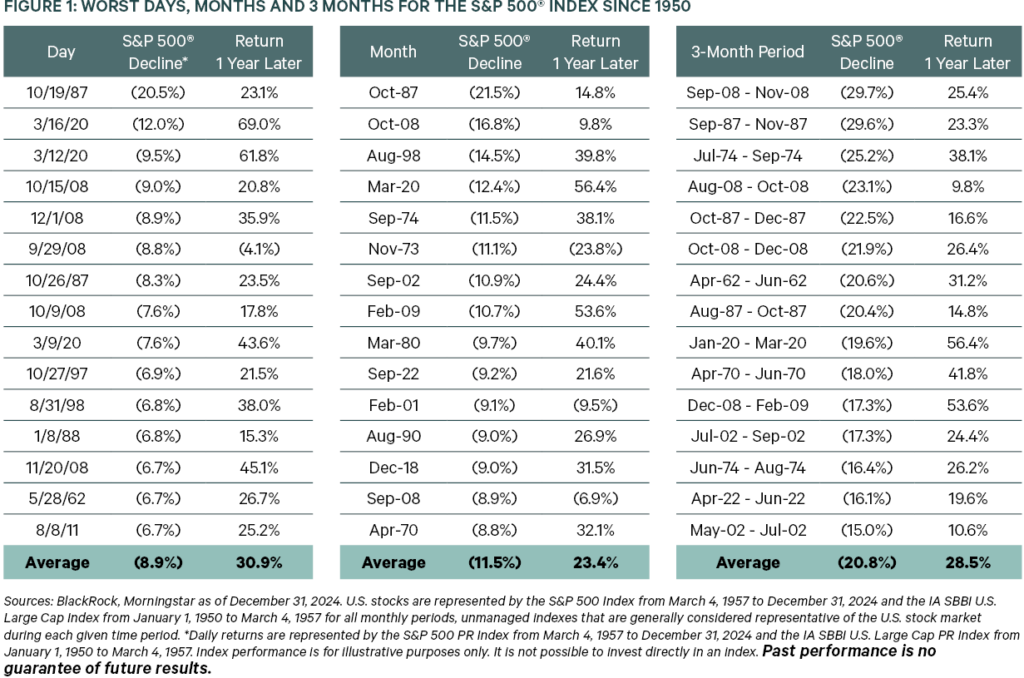
It is impossible to know when and at what level the U.S. equity sell-off will end, but history shows it is almost always a mistake to sell when the market is declining as it has been for the past week or so. Running for the exits during a market rout often means missing out on the opportunity for significant returns when things turn around—and no one knows when that will happen. Giving into panic means selling when prices are dropping, then buying at a higher price point—the exact opposite of what investors want. As Figure 1 shows, big market declines—over a day, a month, or a quarter—are almost always followed by gains:
FIGURE 1: WORST DAYS, MONTHS AND 3 MONTHS FOR THE S&P 500® INDEX SINCE 1950
INCREASED VOLATILITY AND FUTURE RETURNS
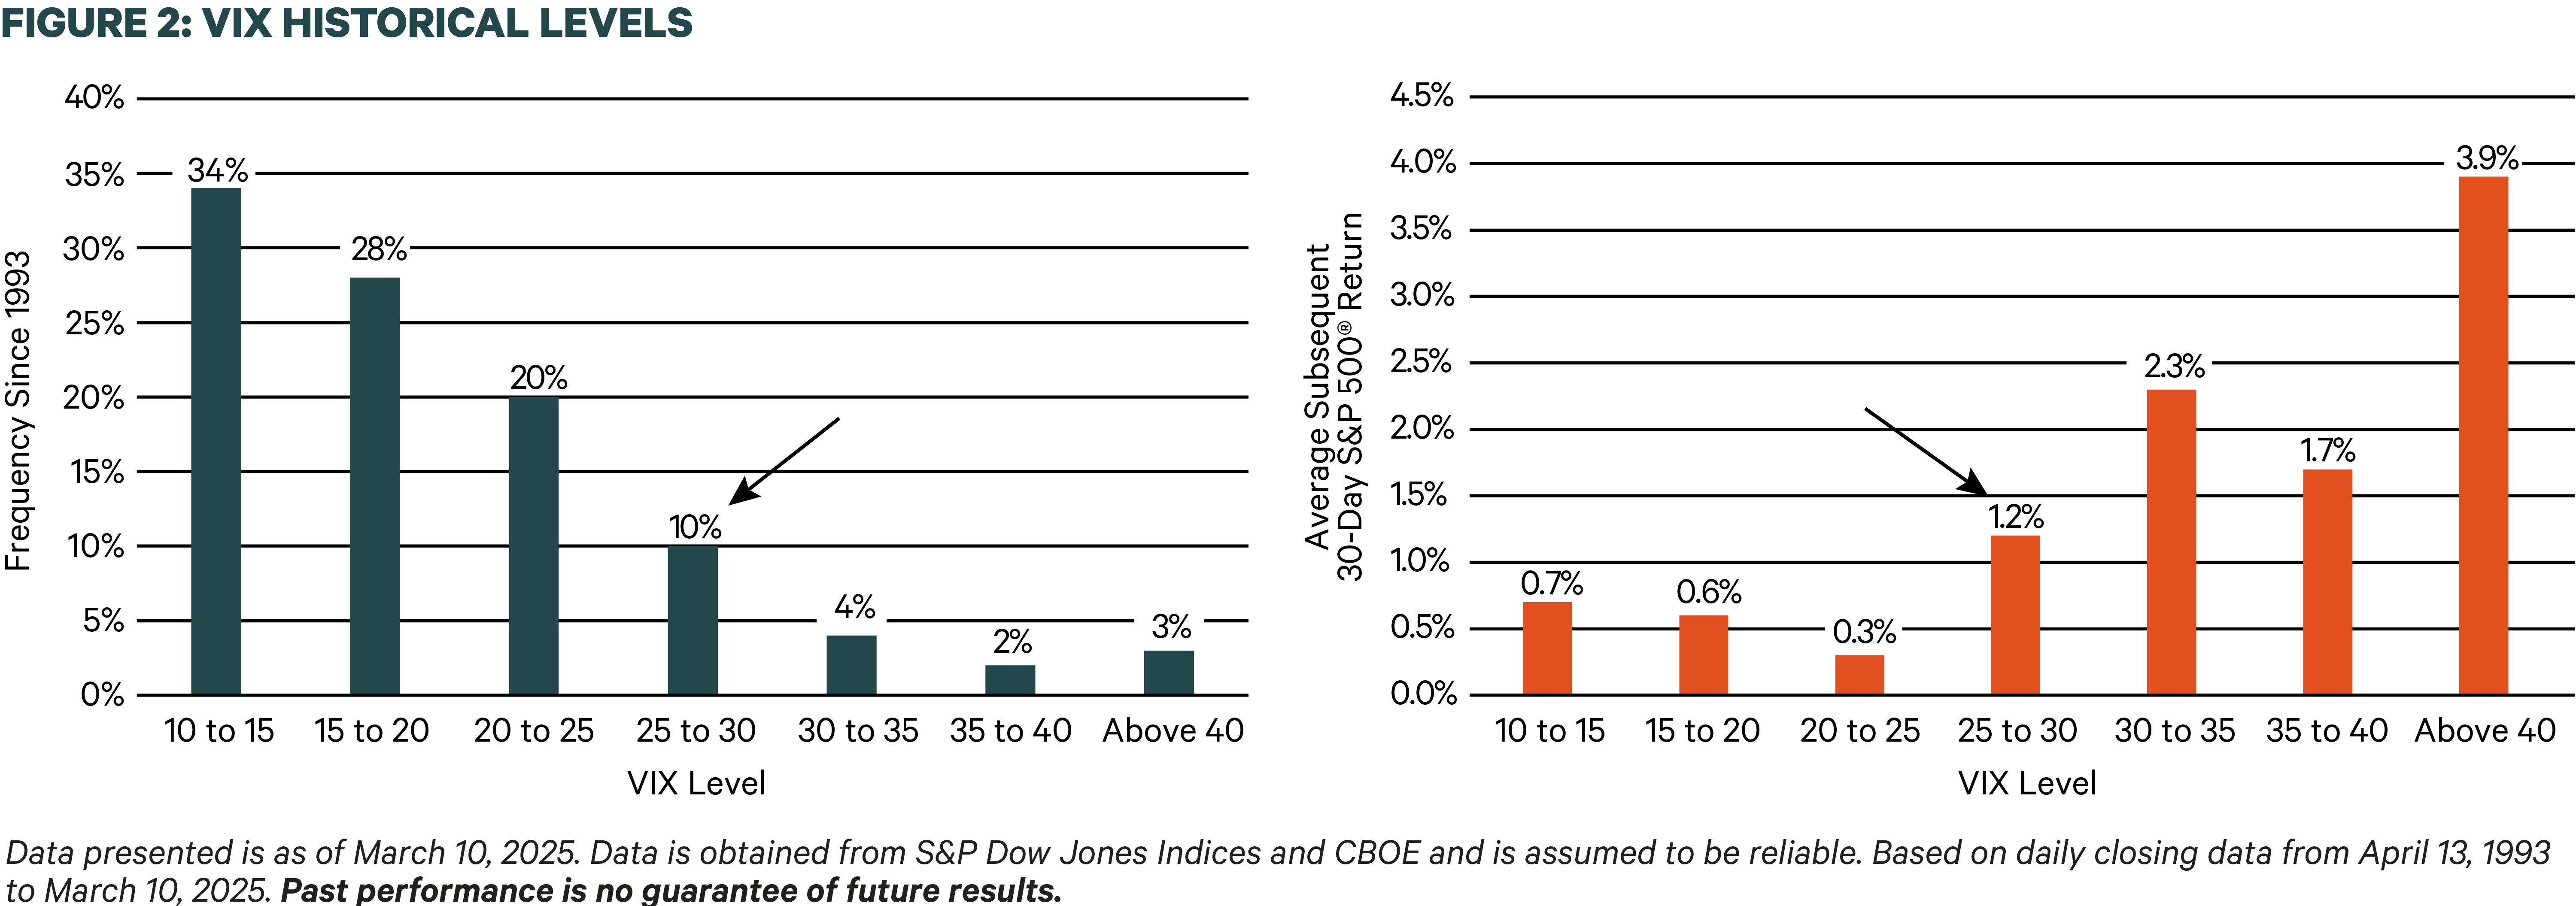
While the noise in the market has been, and may continue to be, loud, the movements severe, and the declines painful, history has shown there can be a positive relationship between increased market volatility, measured by the VIX (the “fear index”) and equity returns. Over the past few days, the VIX has reached the 25-30 range, after languishing at or below its long-term average of 18-20 since President Trump was re-elected.
Looking back over more than three decades, Figure 2 shows that when the VIX has risen to that 25-30 range, the return for the S&P 500 the subsequent 30 days has averaged 1.2%, well above the average 30-day return when volatility is lower.
FIGURE 2: VIX HISTORICAL LEVELS
THE DOWNTURN HAS NOT BEEN FELT EVENLY ACROSS STOCKS
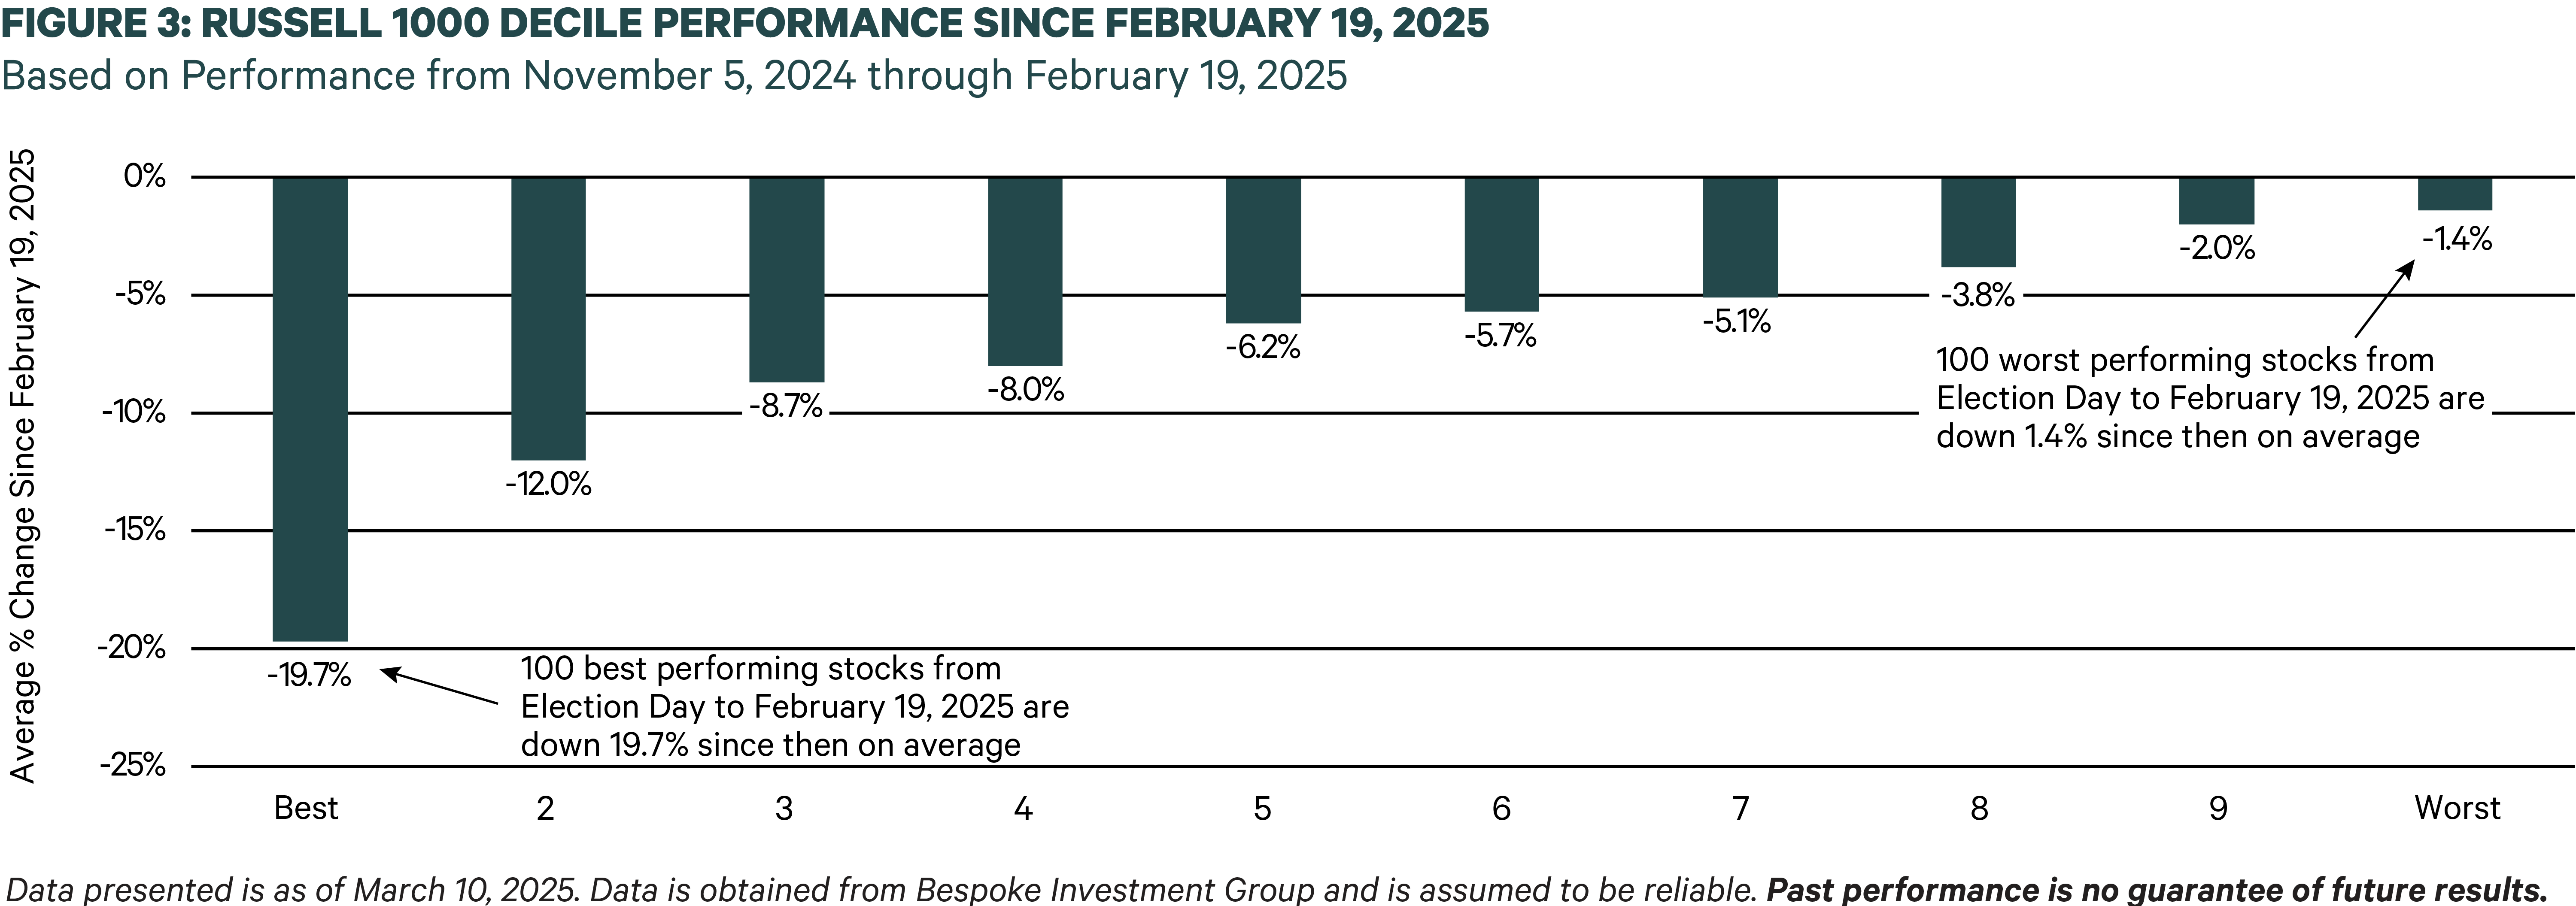
While the increase in market volatility is quite apparent, a less obvious but important aspect of the recent downturn is that not all stocks are declining; in fact, on March 10th, as the S&P fell 2.7%, 155 stocks (over 30%) rose. We also note the best-performing stock that day was up 5.3%, while the worst performer was down 15.4%. That’s a difference of 20.7 percentage points—quite a wide dispersion.
In fact, Figure 2 shows that across the large cap stocks in the Russell 1000 index, those that have fallen the most from the market’s high point on February 19, 2025, were the ones that saw the biggest run-up between Election Day and that February 19th high point. In other words, the stocks that soared the highest have dropped the furthest, while those that did not experience a big post-election run-up have lost far less in this pullback.
THE CURRENT DECLINE IS “PAR FOR THE COURSE”
We also note that while declines like what we have seen this past week are disconcerting, they are not unusual. As of the time of this writing, the drawdown from the recent high on February 19th is roughly 8.2%. That is certainly attention-grabbing, but the median intra-year maximum drawdown since 1985 is about 10%.
It is also helpful to put this in context by observing that the S&P 500 is down by less than 2% from where it was the day before the election in November 2024. Remember, the S&P 500 hit record highs in the past two calendar years, returning roughly 23% in 2023, and 25% in 2024. Giving up some of those gains could be seen as an opportunity for some investors who have been holding onto large amounts of cash to begin to step back in.
In our view, fundamentals matter. As we turn our attention to earnings for Q1 2025, it will be important to monitor revisions in earnings estimates, and we will wait to see what actually happens instead of reacting from fear. As always, we emphasize quality, rather than chasing “hot” stocks, and on a relative basis we believe our strategies have been performing as we would expect and providing protection when things get rough. It is impossible to know where the bottom is, but this could turn out to be an opportunity for some investors who keep a calm head when those around them are running scared.
Index Definitions: The S&P 500 Index is a free-float market capitalization-weighted index of 500 of the largest U.S. companies. The index is calculated on a total return basis with dividends reinvested. The Russell 1000 Index measures the performance of the large-cap segment of the U.S. equity universe. The Russell 1000 Index is a subset of the Russell 3000 Index which is designed to represent approximately 98% of the investable U.S. equity market. It includes approximately 1,000 of the largest securities based on a combination of their market cap and current index membership. The index is calculated on a total return basis with dividends reinvested. The VIX Index is a calculation designed to produce a measure of constant, 30-day expected volatility of the U.S. stock market, derived from real-time, mid-quote prices of S&P 500 Index (SPXSM) call and put options. On a global basis, it is one of the most recognized measures of volatility—widely reported by financial media and closely followed by a variety of market participants as a daily market indicator. The indexes are unmanaged, their returns do not reflect any fees, expenses, or sales charges, and they are not available for direct investment.
This information is being provided by Kayne Anderson Rudnick Investment Management, LLC (“KAR”) for illustrative purposes only. Information in this article is not intended by KAR to be interpreted as investment advice, a recommendation or solicitation to purchase securities, or a recommendation of a particular course of action and has not been updated since the date listed on the correspondence, and KAR does not undertake to update the information presented. This information is based on KAR’s opinions at the time of publication of this material and are subject to change based on market activity. There is no guarantee that any forecasts made will come to pass. KAR makes no warranty as to the accuracy or reliability of the information contained herein. Past performance is no guarantee of future results.