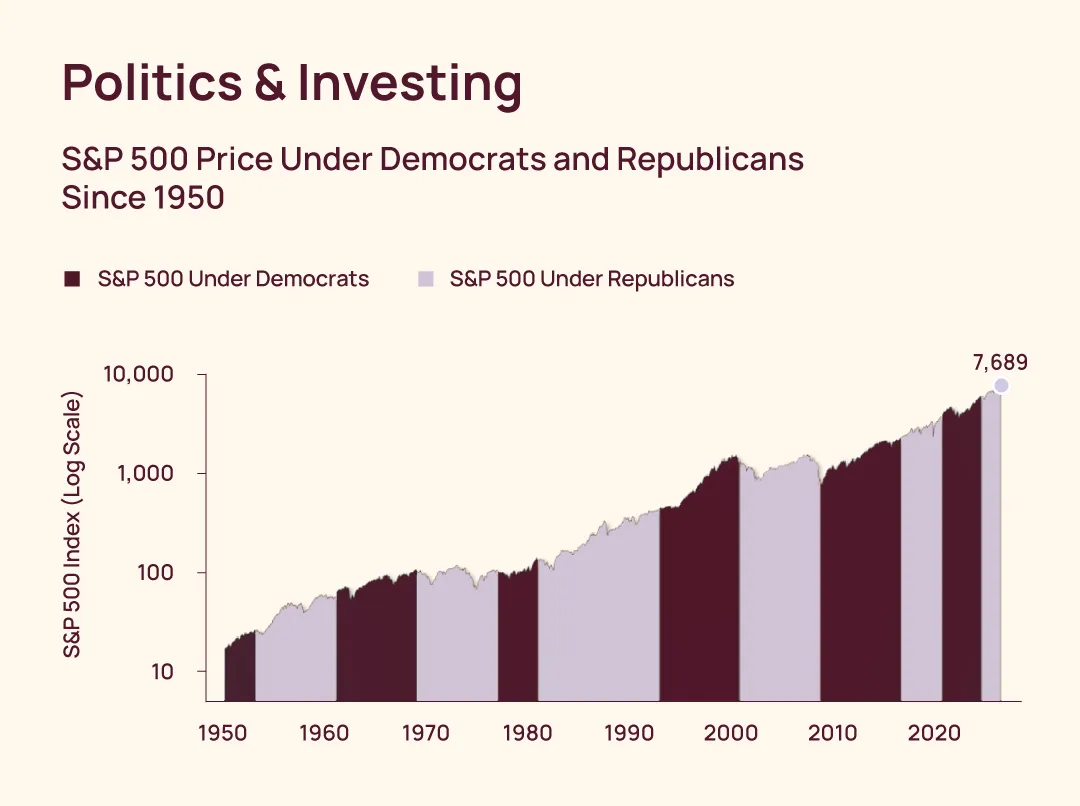
This month’s chart tracks the growth of the S&P 500 across Democratic and Republican presidential administrations. While political leadership has changed many times, the chart shows that the market’s long-term upward trajectory has continued under both parties.
Source: © Exhibit A, FactSet Research Systems Inc. I Latest: 2026-11-04.
The S&P 500® Index is a free-float market capitalization-weighted index of 500 of the largest U.S. companies. The index is calculated on a total return basis with dividends reinvested. The index is unmanaged, its returns do not reflect any fees, expenses, or sales charges, and is not available for direct investment. Past performance is no guarantee of future results.
A Look at the Data
Since 1953, the S&P 500 has experienced periods of growth and decline under both Democratic and Republican administrations. Although political developments can contribute to short-term market movements, the chart does not show a consistent relationship between the party in the White House and the direction of the market. Over the full period shown, the index rose substantially through numerous changes in political leadership.
Why This Matters for Clients
Elections and policy changes can create uncertainty and lead investors to question how political outcomes may affect their portfolios. This chart provides helpful historical context, showing that long-term market growth has occurred under both parties.
While past performance does not indicate future results, the data reinforces the importance of keeping investment decisions aligned with long-term goals rather than reacting to political headlines or election outcomes.
To discuss how current market conditions may factor into your investment strategy, contact a KAR Wealth Advisor.