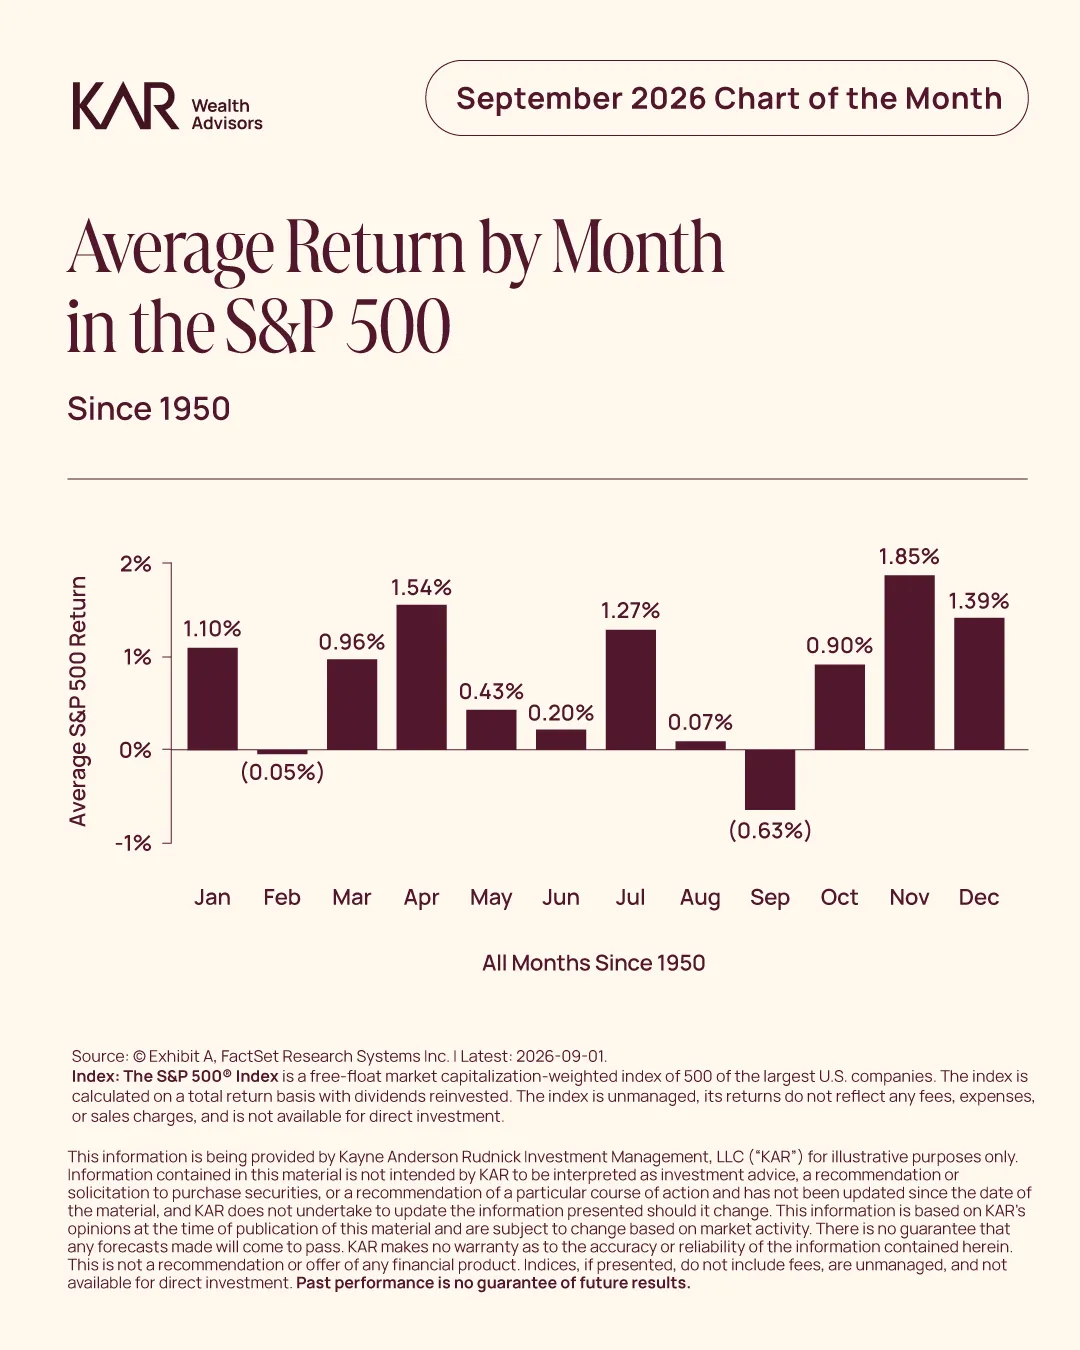
The S&P 500’s average return by calendar month since 1950 provides historical context on how market performance has varied throughout the year. While certain months have historically produced stronger or weaker returns on average, these patterns should be viewed as observations rather than predictions.
September has historically been the weakest month for the S&P 500, with an average return of -0.63% since 1950. In contrast, November has produced the strongest average return at 1.85%. While certain months have historically generated stronger or weaker returns on average, monthly market performance has varied considerably from year to year, reflecting the influence of economic conditions, corporate earnings, monetary policy, and investor sentiment.
Historical seasonal patterns can provide perspective on how market returns have varied throughout the calendar year. However, these patterns have not occurred consistently and should be viewed as historical observations rather than predictive indicators. Market conditions and other factors ultimately influence investment outcomes, reinforcing the importance of maintaining a disciplined, long-term investment approach.