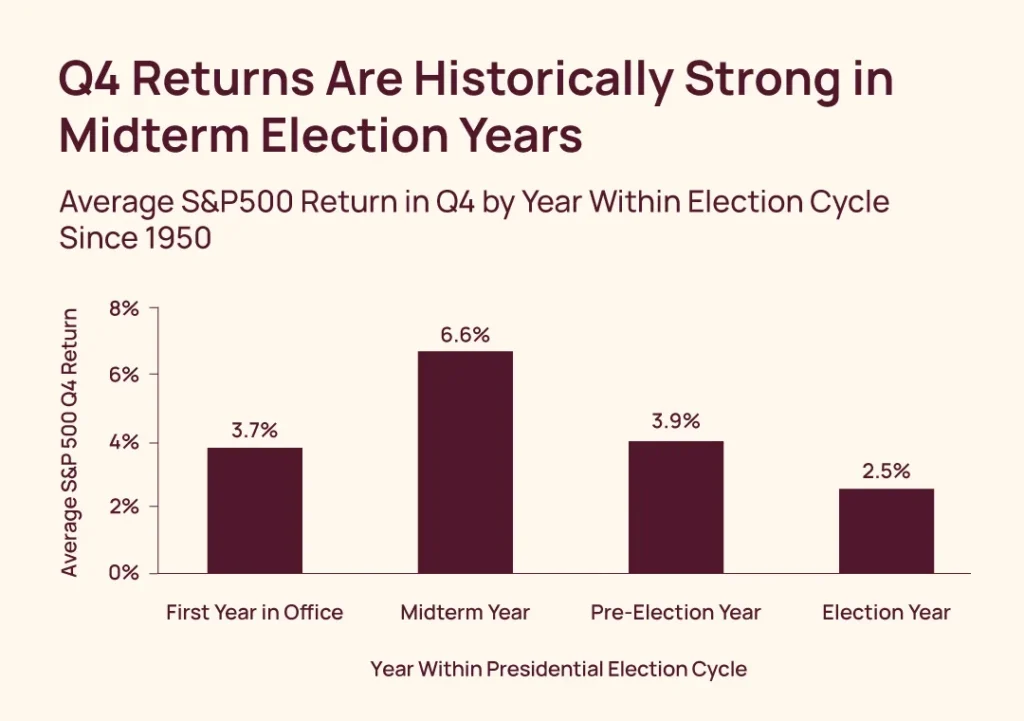
The presidential election cycle often attracts heightened investor attention, particularly as year-end approaches. This month’s chart examines the average fourth-quarter return for the S&P 500 since 1950, grouped by year within the four-year presidential election cycle. The data provides historical context for how markets have performed during the final quarter under different political environments.
Source: © Exhibit A, FactSet Research Systems Inc., Standard & Poor’s
The S&P 500® Index is a free-float market capitalization-weighted index of 500 of the largest U.S. companies. The index is calculated on a total return basis with dividends reinvested. The index is unmanaged, its returns do not reflect any fees, expenses, or sales charges, and is not available for direct investment. Past performance is no guarantee of future results.
A Look at the Data
Average fourth-quarter returns for the S&P 500 have been positive across all four years of the presidential election cycle since 1950. Midterm years have historically delivered the strongest Q4 performance, averaging 6.6%, while election years have been the weakest at 2.5%. Returns during the first year in office and pre-election years averaged 3.7% and 3.9%, respectively. Together, the data shows that positive fourth-quarter returns have historically occurred regardless of where the market is within the election cycle.
Why This Matters for Clients
Investors often wonder how elections may influence market performance. This chart offers a broader historical perspective, showing that the S&P 500 has generated positive average fourth-quarter returns throughout each phase of the election cycle. While past results do not indicate future performance, we believe historical data can be a helpful reminder to focus on long-term goals rather than short-term market narratives.
Interested in More Market Insights?
Explore more insights and perspectives on the trends shaping today’s investment landscape.